Summary across runs
Each run’s measurements stay separate; boxes span recorded 95% intervals, with a line at the estimate, read as in Reading a run report. The displayed measurements keep their benchmark identifiers.
Coverage: Apple M4 · generic · full · ef9e82d3 appears in Insertion, Scaling, Batching, Native and generic builds, Hash to curve, Insertion cost model, Curve selection time, Cost per item with selection. Intel(R) Xeon(R) W-1390P @ 3.50GHz · x86-64-v3 · full · ef9e82d3 appears in Insertion, Scaling, Batching, Hash to curve, Insertion cost model, Curve selection, Curve selection time, Cost per item with selection. Intel(R) Xeon(R) W-1390P @ 3.50GHz · generic · full · ef9e82d3 appears in Insertion, Scaling, Batching, Hash to curve, Insertion cost model, Curve selection time, Cost per item with selection.
-
Apple M4 · apple-m4 · full · ef9e82d3: The run started 2026-10-08T02:49:59Z on Apple M4 (macOS 27.0.1, arm64) and timed commit ef9e82d39fbf06c605e1740360370f0003dc4ca4, built by rustc 1.98.1 (48a229cea 2026-09-01) with RUSTFLAGS -C target-cpu=apple-m4, in the full profile.
-
Apple M4 · generic · full · ef9e82d3: The run started 2026-10-08T07:13:46Z on Apple M4 (macOS 27.0.1, arm64) and timed commit ef9e82d39fbf06c605e1740360370f0003dc4ca4, built by rustc 1.98.1 (48a229cea 2026-09-01) with RUSTFLAGS -C target-cpu=generic, in the full profile.
-
Intel(R) Xeon(R) W-1390P @ 3.50GHz · x86-64-v3 · full · ef9e82d3: The run started 2026-10-08T18:42:23Z on Intel(R) Xeon(R) W-1390P @ 3.50GHz (?, x86_64) and timed commit ef9e82d39fbf06c605e1740360370f0003dc4ca4, built by rustc 1.98.1 (48a229cea 2026-09-01) with RUSTFLAGS -C target-cpu=x86-64-v3 -C target-feature=+pclmulqdq, in the full profile.
-
Intel(R) Xeon(R) W-1390P @ 3.50GHz · generic · full · ef9e82d3: The run started 2026-10-09T15:12:32Z on Intel(R) Xeon(R) W-1390P @ 3.50GHz (?, x86_64) and timed commit ef9e82d39fbf06c605e1740360370f0003dc4ca4, built by rustc 1.98.1 (48a229cea 2026-09-01) with RUSTFLAGS -C target-cpu=x86-64, in the full profile.
Insertion
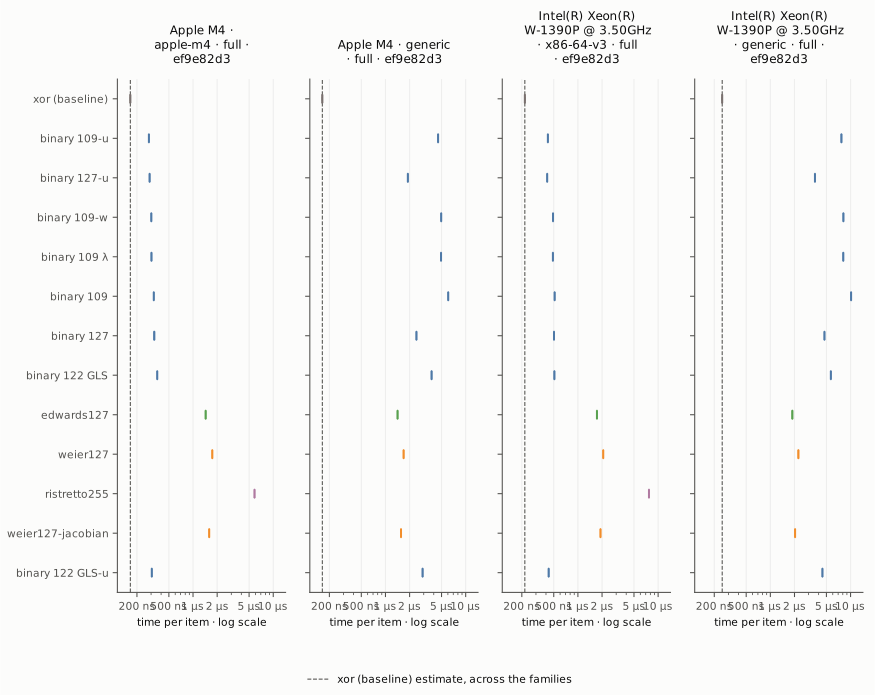
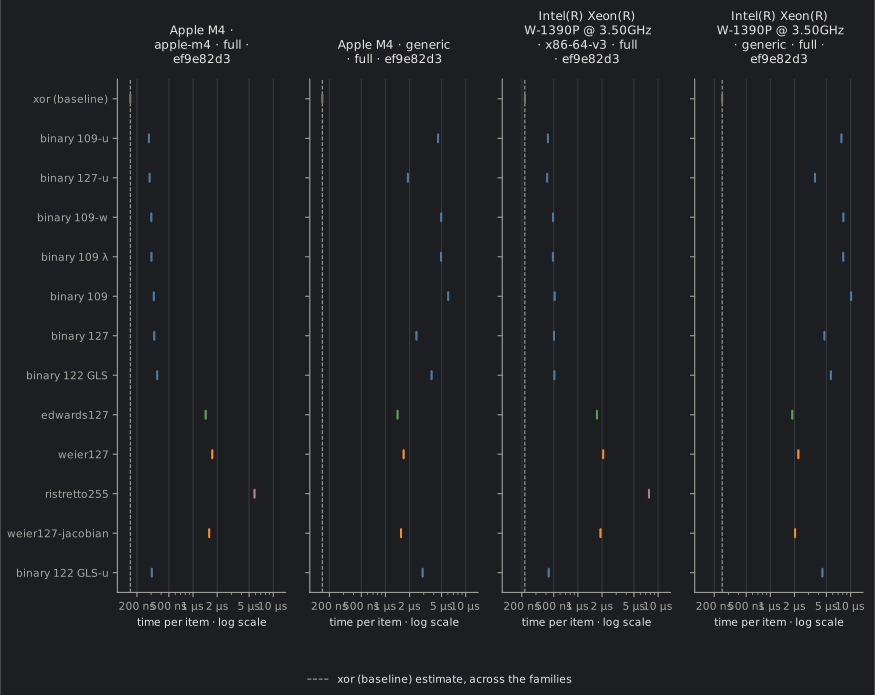
RIBLT encoding per item: items into a sketch of cells, the coded symbols that decode differences, under each family’s cheapest measured hash; each run’s three fastest curves, those whose intervals overlap the third, and the representative families, ristretto255 among them. The first row is the insecure XOR baseline, SHA-256 digests XORed into 32-byte cells; the dashed line carries its estimate across the families.
Apple M4 · apple-m4 · full · ef9e82d3: binary 109-u 281.8 ns (281.4–282.2); binary 127-u 287.6 ns (287.0–288.1); binary 109-w 302.2 ns (301.6–302.8). The first two recorded intervals are separated. The third estimate takes 7.2% more time than the first. Also overlapping the third interval: binary 109 λ.
Apple M4 · generic · full · ef9e82d3: edwards127 1415.2 ns (1412.4–1418.1); weier127-jacobian 1562.7 ns (1559.9–1565.6); weier127 1683.2 ns (1679.6–1686.8). The first two recorded intervals are separated. The third estimate takes 18.9% more time than the first.
Intel(R) Xeon(R) W-1390P @ 3.50GHz · x86-64-v3 · full · ef9e82d3: binary 127-u 414.3 ns (413.8–414.9); binary 109-u 422.3 ns (421.7–422.9); binary 122 GLS-u 432.0 ns (431.1–432.9). The first two recorded intervals are separated. The third estimate takes 4.3% more time than the first.
Intel(R) Xeon(R) W-1390P @ 3.50GHz · generic · full · ef9e82d3: edwards127 1879.9 ns (1873.4–1887.5); weier127-jacobian 2034.9 ns (2030.2–2039.9); weier127 2235.7 ns (2227.7–2245.0). The first two recorded intervals are separated. The third estimate takes 18.9% more time than the first.
Coverage: Apple M4 · apple-m4 · full · ef9e82d3: 12 displayed curves of 32 measured rows (including baselines); Apple M4 · generic · full · ef9e82d3: 11 displayed curves of 21 measured rows (including baselines); Intel(R) Xeon(R) W-1390P @ 3.50GHz · x86-64-v3 · full · ef9e82d3: 12 displayed curves of 32 measured rows (including baselines); Intel(R) Xeon(R) W-1390P @ 3.50GHz · generic · full · ef9e82d3: 11 displayed curves of 21 measured rows (including baselines).
Scaling
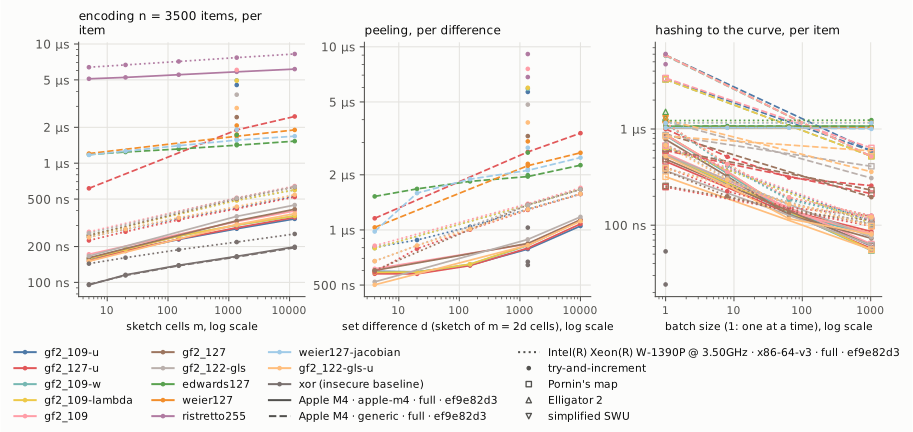
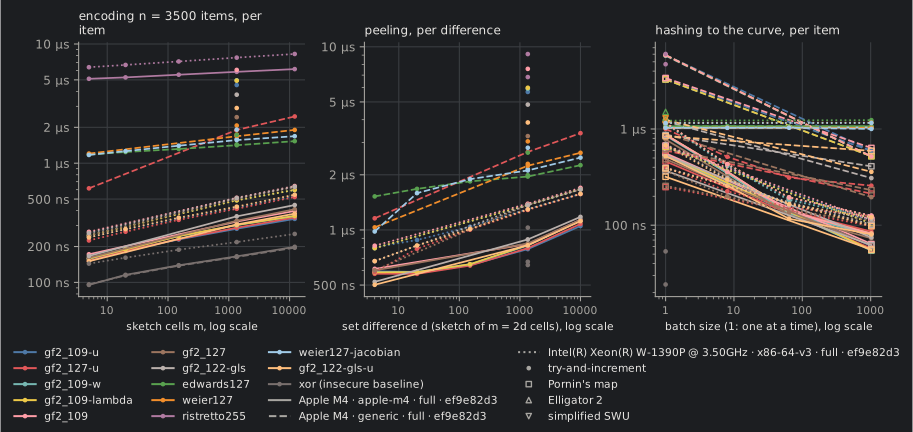
Encoding per item against the sketch’s cells , items; peeling per difference against the set difference , in a sketch of cells with the prefilter and batched hashes; hashing per item against the batch size, try-and-increment filled and the comparison maps open; the hashes of ristretto255 and of the XOR baseline, a SHA-256 digest, have no batched form and are a single mark at batch size 1. Bands are recorded intervals; line style tells the runs apart.
Batching
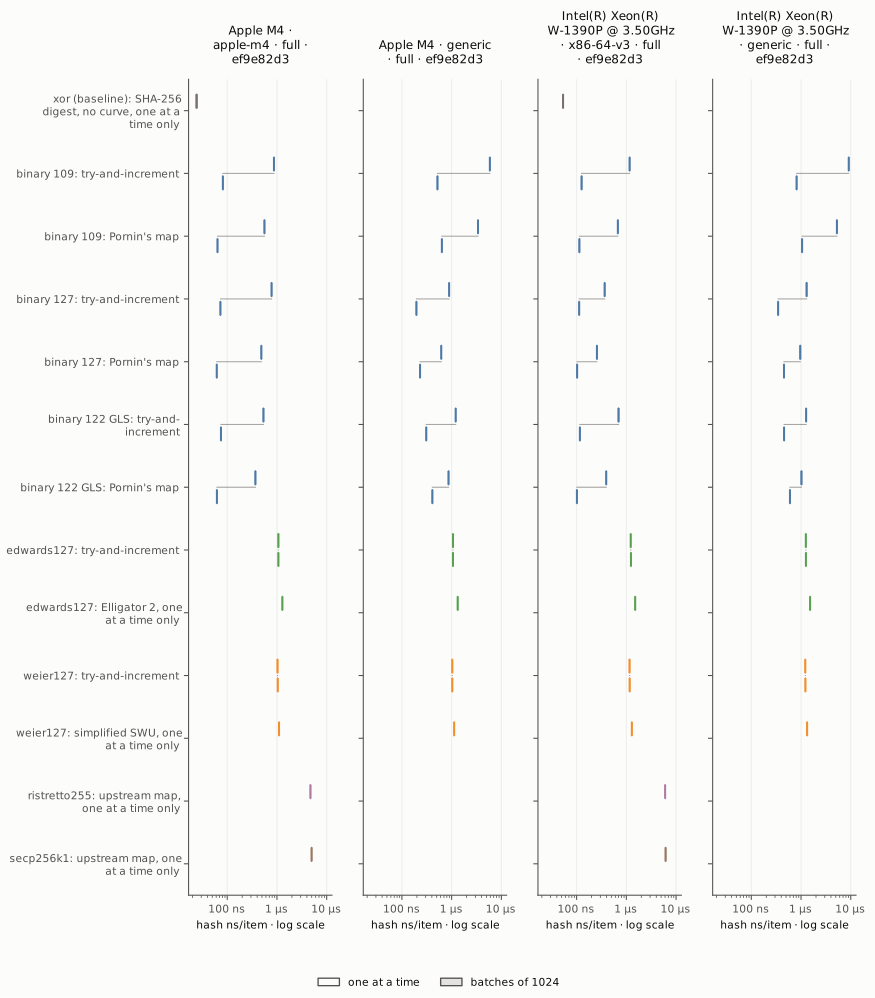
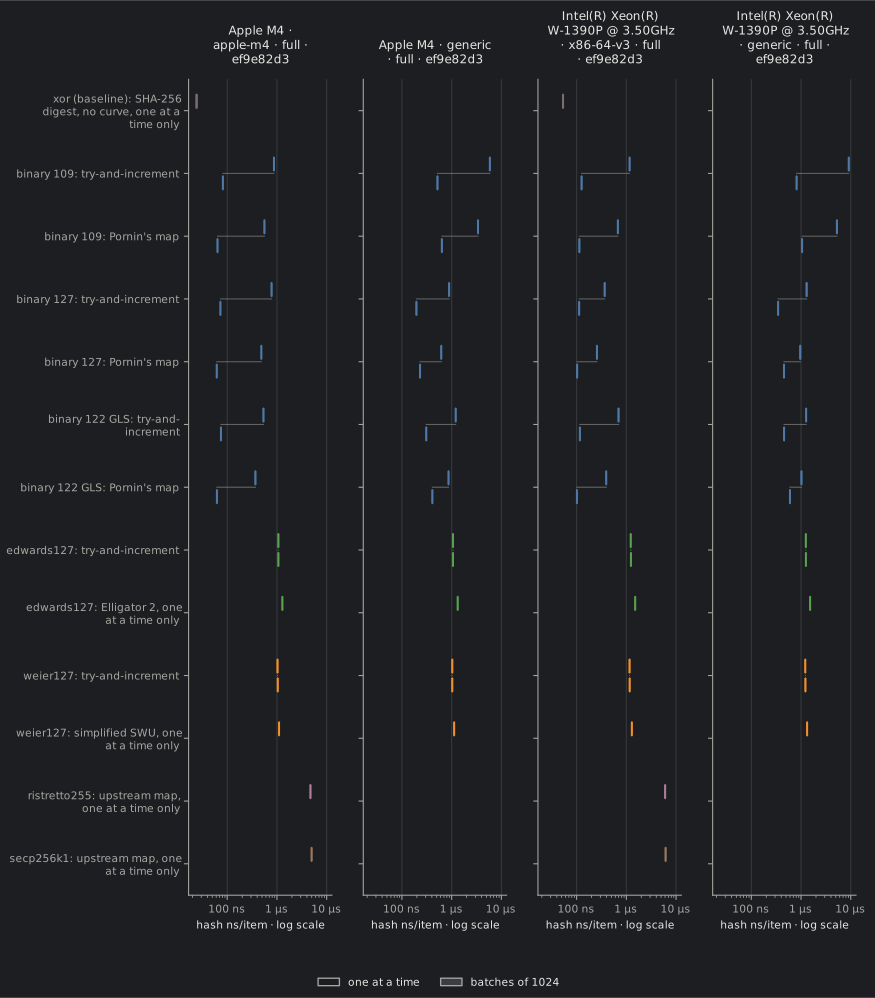
Hashing per item by construction, one item at a time and in batches of 1024; a grey line joins a construction’s two estimates. Batching shares the field inversion; the prime-field hashes are bound by a square root per item, which it does not share. ristretto255’s hash and the XOR baseline’s SHA-256 digest have no batched form: each is a single hollow box, labelled one at a time only. The table gives the time saved, .
| Run | Family | Hash | Batch time change |
|---|---|---|---|
| Apple M4 · apple-m4 · full · ef9e82d3 | xor (baseline) | SHA-256 digest, no curve | individual only; the digest is timed one at a time |
| Apple M4 · apple-m4 · full · ef9e82d3 | binary 109 | try-and-increment | 90.6% saved |
| Apple M4 · apple-m4 · full · ef9e82d3 | binary 109 | Pornin’s map | 88.6% saved |
| Apple M4 · apple-m4 · full · ef9e82d3 | binary 127 | try-and-increment | 90.6% saved |
| Apple M4 · apple-m4 · full · ef9e82d3 | binary 127 | Pornin’s map | 87.3% saved |
| Apple M4 · apple-m4 · full · ef9e82d3 | binary 122 GLS | try-and-increment | 86.0% saved |
| Apple M4 · apple-m4 · full · ef9e82d3 | binary 122 GLS | Pornin’s map | 83.2% saved |
| Apple M4 · apple-m4 · full · ef9e82d3 | edwards127 | try-and-increment | 0.0% more time |
| Apple M4 · apple-m4 · full · ef9e82d3 | edwards127 | Elligator 2 | only one mode measured |
| Apple M4 · apple-m4 · full · ef9e82d3 | weier127 | try-and-increment | 0.9% more time |
| Apple M4 · apple-m4 · full · ef9e82d3 | weier127 | simplified SWU | only one mode measured |
| Apple M4 · apple-m4 · full · ef9e82d3 | ristretto255 | upstream map | individual only; comparison harness has no batched entrypoint |
| Apple M4 · apple-m4 · full · ef9e82d3 | secp256k1 | upstream map | individual only; comparison harness has no batched entrypoint |
| Apple M4 · generic · full · ef9e82d3 | binary 109 | try-and-increment | 91.2% saved |
| Apple M4 · generic · full · ef9e82d3 | binary 109 | Pornin’s map | 81.3% saved |
| Apple M4 · generic · full · ef9e82d3 | binary 127 | try-and-increment | 78.0% saved |
| Apple M4 · generic · full · ef9e82d3 | binary 127 | Pornin’s map | 62.6% saved |
| Apple M4 · generic · full · ef9e82d3 | binary 122 GLS | try-and-increment | 74.4% saved |
| Apple M4 · generic · full · ef9e82d3 | binary 122 GLS | Pornin’s map | 52.7% saved |
| Apple M4 · generic · full · ef9e82d3 | edwards127 | try-and-increment | 0.1% saved |
| Apple M4 · generic · full · ef9e82d3 | edwards127 | Elligator 2 | only one mode measured |
| Apple M4 · generic · full · ef9e82d3 | weier127 | try-and-increment | 0.1% saved |
| Apple M4 · generic · full · ef9e82d3 | weier127 | simplified SWU | only one mode measured |
| Intel(R) Xeon(R) W-1390P @ 3.50GHz · x86-64-v3 · full · ef9e82d3 | xor (baseline) | SHA-256 digest, no curve | individual only; the digest is timed one at a time |
| Intel(R) Xeon(R) W-1390P @ 3.50GHz · x86-64-v3 · full · ef9e82d3 | binary 109 | try-and-increment | 89.2% saved |
| Intel(R) Xeon(R) W-1390P @ 3.50GHz · x86-64-v3 · full · ef9e82d3 | binary 109 | Pornin’s map | 83.2% saved |
| Intel(R) Xeon(R) W-1390P @ 3.50GHz · x86-64-v3 · full · ef9e82d3 | binary 127 | try-and-increment | 69.2% saved |
| Intel(R) Xeon(R) W-1390P @ 3.50GHz · x86-64-v3 · full · ef9e82d3 | binary 127 | Pornin’s map | 60.0% saved |
| Intel(R) Xeon(R) W-1390P @ 3.50GHz · x86-64-v3 · full · ef9e82d3 | binary 122 GLS | try-and-increment | 83.3% saved |
| Intel(R) Xeon(R) W-1390P @ 3.50GHz · x86-64-v3 · full · ef9e82d3 | binary 122 GLS | Pornin’s map | 74.3% saved |
| Intel(R) Xeon(R) W-1390P @ 3.50GHz · x86-64-v3 · full · ef9e82d3 | edwards127 | try-and-increment | 1.1% more time |
| Intel(R) Xeon(R) W-1390P @ 3.50GHz · x86-64-v3 · full · ef9e82d3 | edwards127 | Elligator 2 | only one mode measured |
| Intel(R) Xeon(R) W-1390P @ 3.50GHz · x86-64-v3 · full · ef9e82d3 | weier127 | try-and-increment | 0.4% more time |
| Intel(R) Xeon(R) W-1390P @ 3.50GHz · x86-64-v3 · full · ef9e82d3 | weier127 | simplified SWU | only one mode measured |
| Intel(R) Xeon(R) W-1390P @ 3.50GHz · x86-64-v3 · full · ef9e82d3 | ristretto255 | upstream map | individual only; comparison harness has no batched entrypoint |
| Intel(R) Xeon(R) W-1390P @ 3.50GHz · x86-64-v3 · full · ef9e82d3 | secp256k1 | upstream map | individual only; comparison harness has no batched entrypoint |
| Intel(R) Xeon(R) W-1390P @ 3.50GHz · generic · full · ef9e82d3 | binary 109 | try-and-increment | 91.1% saved |
| Intel(R) Xeon(R) W-1390P @ 3.50GHz · generic · full · ef9e82d3 | binary 109 | Pornin’s map | 80.0% saved |
| Intel(R) Xeon(R) W-1390P @ 3.50GHz · generic · full · ef9e82d3 | binary 127 | try-and-increment | 73.2% saved |
| Intel(R) Xeon(R) W-1390P @ 3.50GHz · generic · full · ef9e82d3 | binary 127 | Pornin’s map | 53.0% saved |
| Intel(R) Xeon(R) W-1390P @ 3.50GHz · generic · full · ef9e82d3 | binary 122 GLS | try-and-increment | 64.0% saved |
| Intel(R) Xeon(R) W-1390P @ 3.50GHz · generic · full · ef9e82d3 | binary 122 GLS | Pornin’s map | 41.3% saved |
| Intel(R) Xeon(R) W-1390P @ 3.50GHz · generic · full · ef9e82d3 | edwards127 | try-and-increment | 0.5% more time |
| Intel(R) Xeon(R) W-1390P @ 3.50GHz · generic · full · ef9e82d3 | edwards127 | Elligator 2 | only one mode measured |
| Intel(R) Xeon(R) W-1390P @ 3.50GHz · generic · full · ef9e82d3 | weier127 | try-and-increment | 0.6% more time |
| Intel(R) Xeon(R) W-1390P @ 3.50GHz · generic · full · ef9e82d3 | weier127 | simplified SWU | only one mode measured |
Native and generic builds
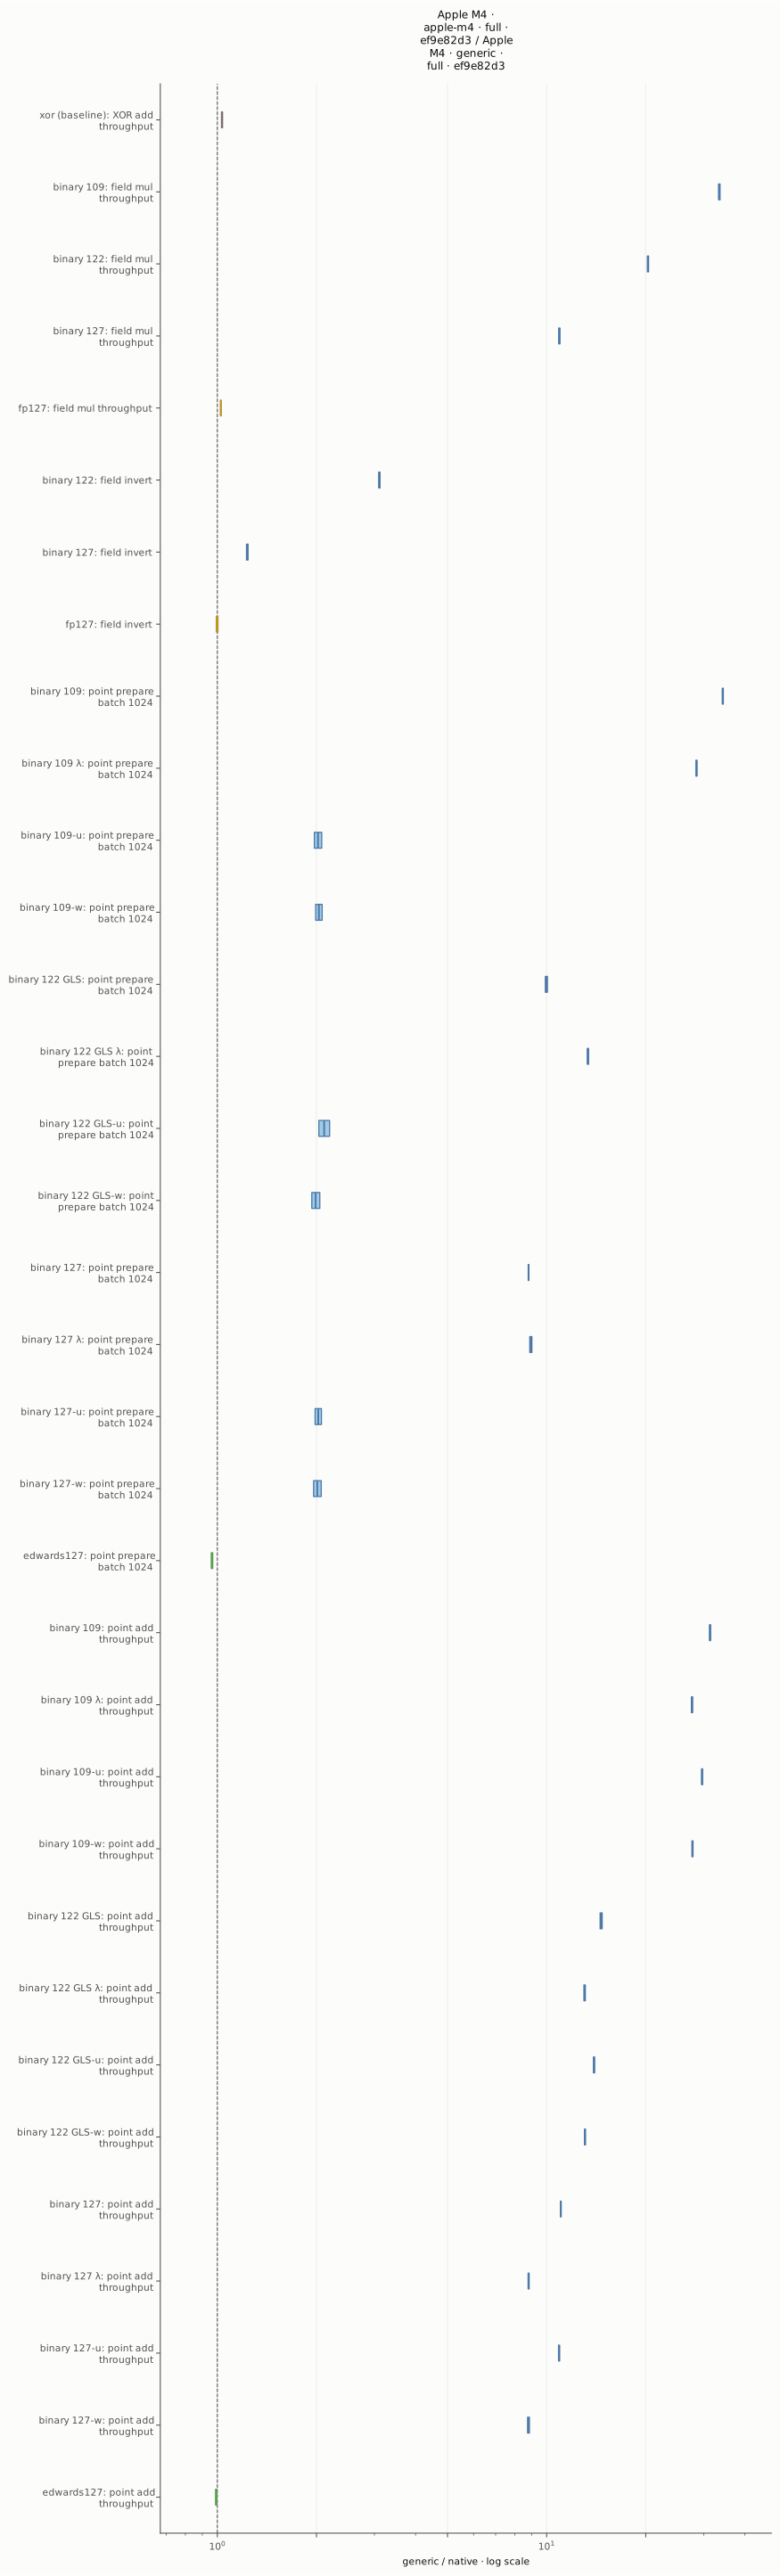
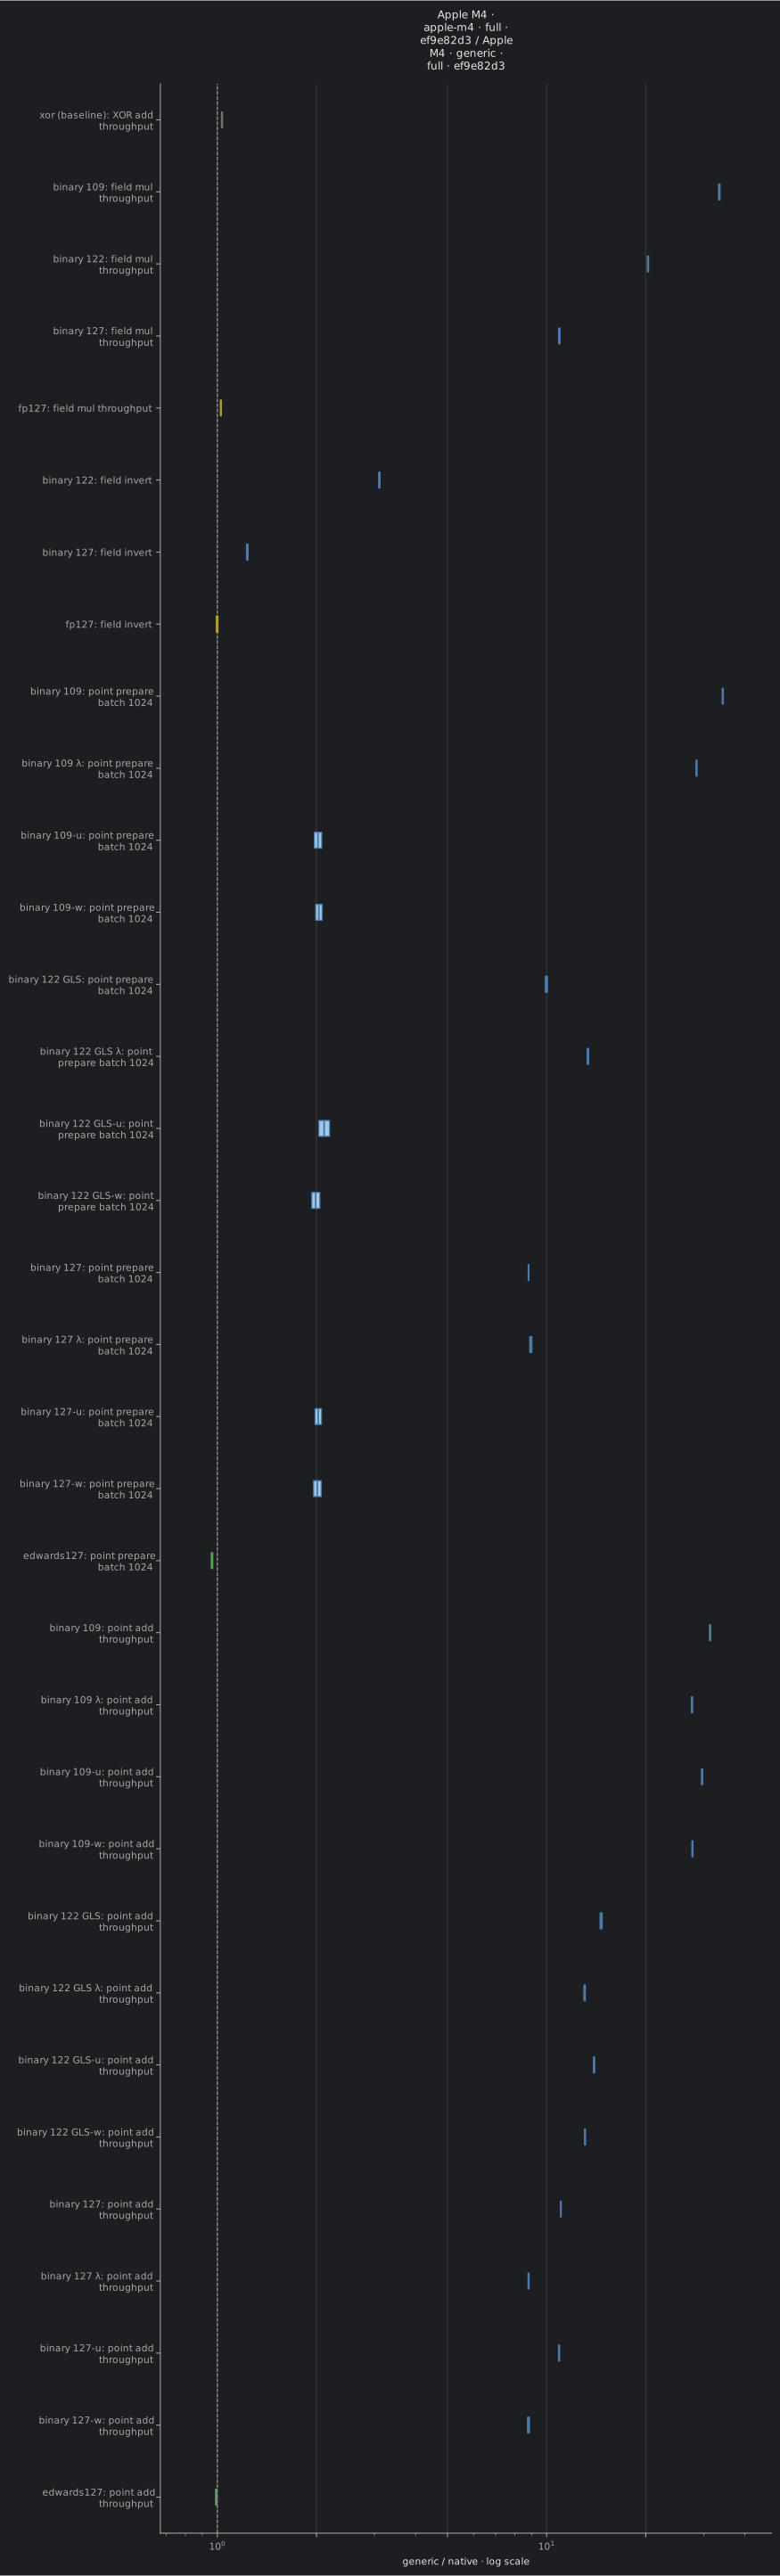
Generic over native time for benchmarks matched on one CPU, source and compiler; the dashed line is parity, boxes the propagated ranges. ristretto255’s point addition and the XOR baseline’s addition of 32-byte digests, both at throughput, are matched as references where both runs timed them.
Matched group models in Apple M4 · generic · full · ef9e82d3: edwards127, binary 109, binary 109 λ, binary 109-u, binary 109-w, binary 122 GLS, binary 122 GLS λ, binary 122 GLS-u, binary 122 GLS-w, binary 127, binary 127 λ, binary 127-u, binary 127-w. Other models need corresponding generic measurements.
Hash to curve
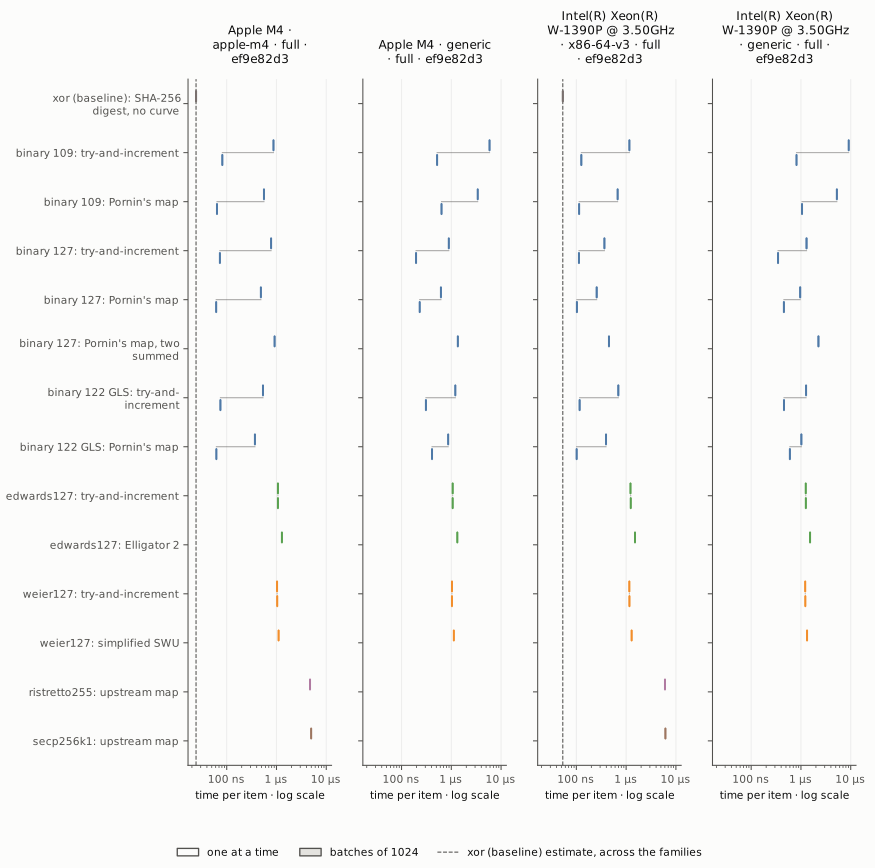
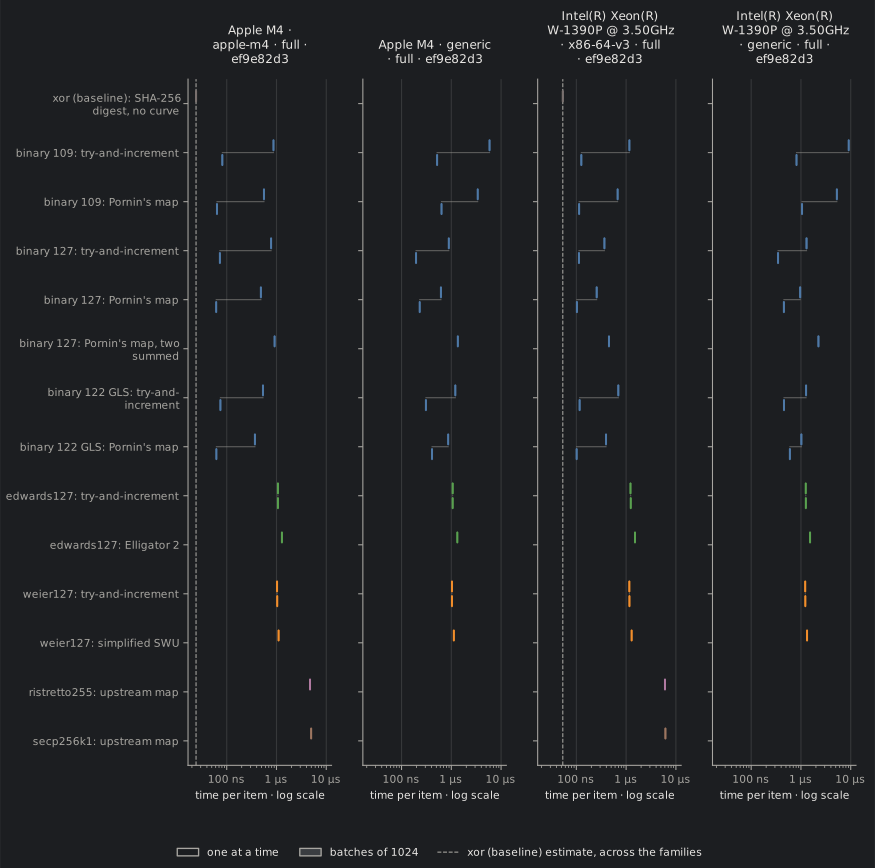
Hashing per item by construction for the representative families, one item at a time and in batches of 1024; a grey line joins a construction’s two estimates. Constructions differ in the representation they return, as the benchmark identifiers in the data state. The XOR baseline’s row is its SHA-256 digest, which maps to no curve, and the dashed line carries its estimate across the families; ristretto255’s and secp256k1’s hashes are their libraries’ maps, timed one at a time only.
Insertion cost model
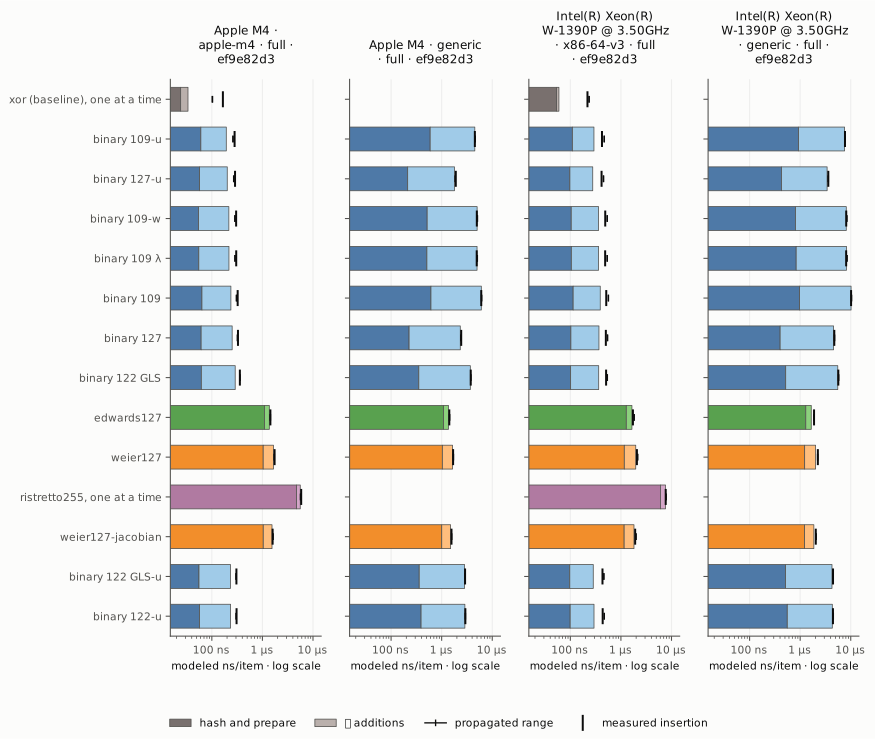
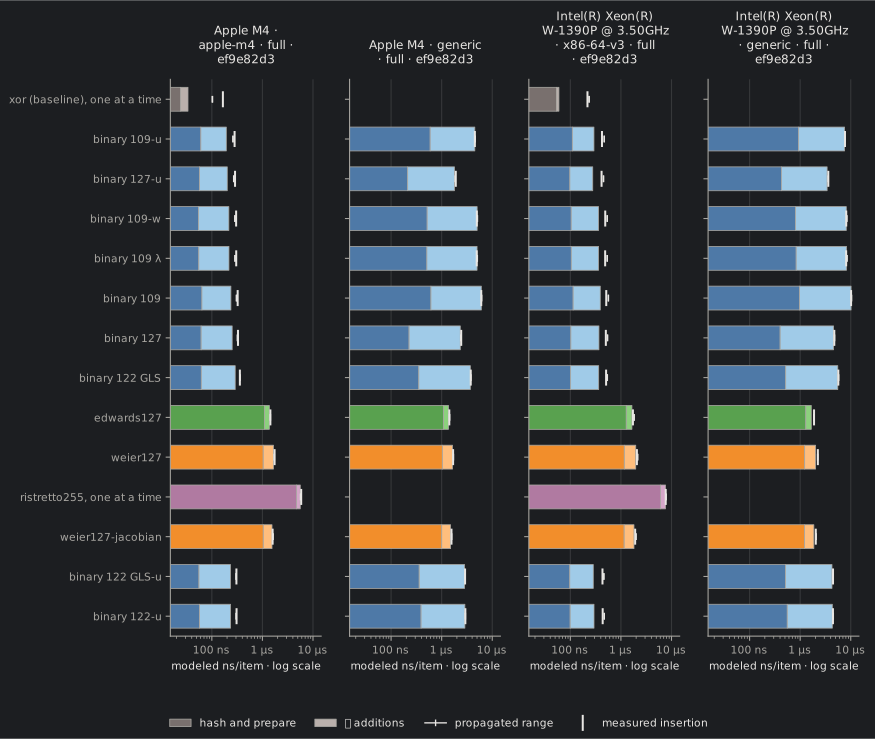
Modeled insertion per item under each family’s cheapest compatible recipe, a fused hash to the addend counting as hash and prepare, and additions at throughput. A sketch of cells, the coded symbols that decode differences, maps an item to cells on average (Workload). The measured insertion includes what the model omits. ristretto255 and the XOR baseline have no batched hash: they hash one item at a time and add the hash output as is, with nothing to prepare. The XOR baseline is absent from Apple M4 · generic · full · ef9e82d3, Intel(R) Xeon(R) W-1390P @ 3.50GHz · generic · full · ef9e82d3: its addition was not timed at throughput, with eight accumulators, there. The time axis is logarithmic, as the totals span more than a factor of ten: a segment’s boundaries read as cumulative times, its length not as its share.
Curve selection
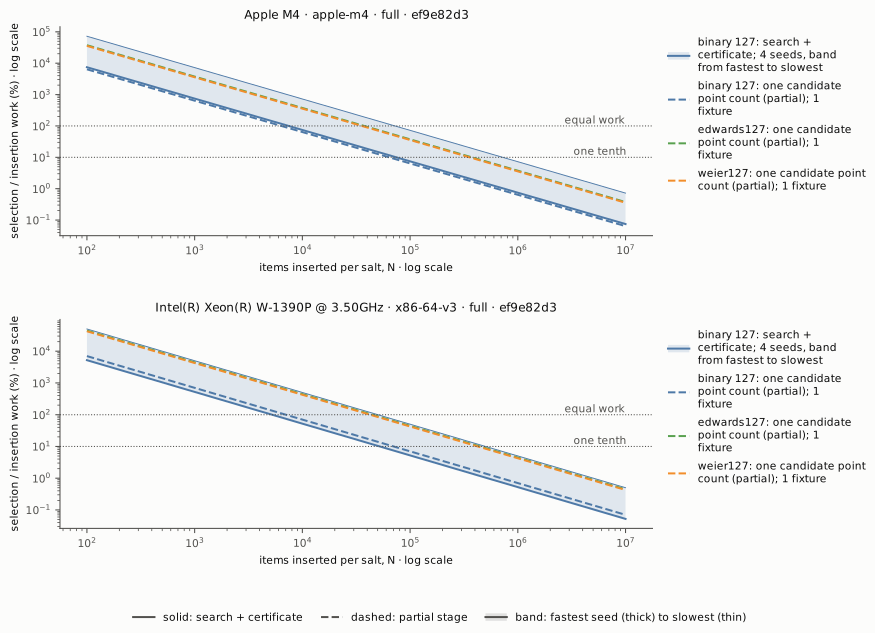
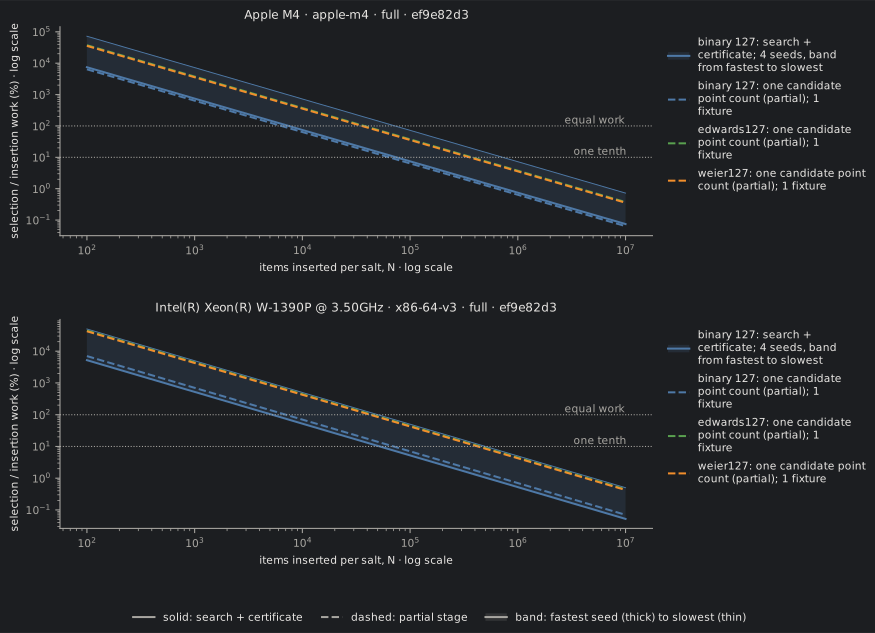
Selection work per salt as a percentage of the insertion work it is amortised over, , against the items inserted per salt, with the measured insertion per item ( items into a sketch of cells, as in Insertion). The band spans the seeds, the fastest thick and the slowest thin; dashed curves are partial stages, lower bounds on . Normalised by each family’s own , the figure reads as the volume that amortises selection, but it credits a family that is slow to insert with a smaller ratio for the same ; the next two figures give and the cost per item in absolute time. The baselines, XOR and ristretto255, select no curve: their ratio is zero, which a log axis cannot show, and they appear in the absolute figures.
Curve selection time
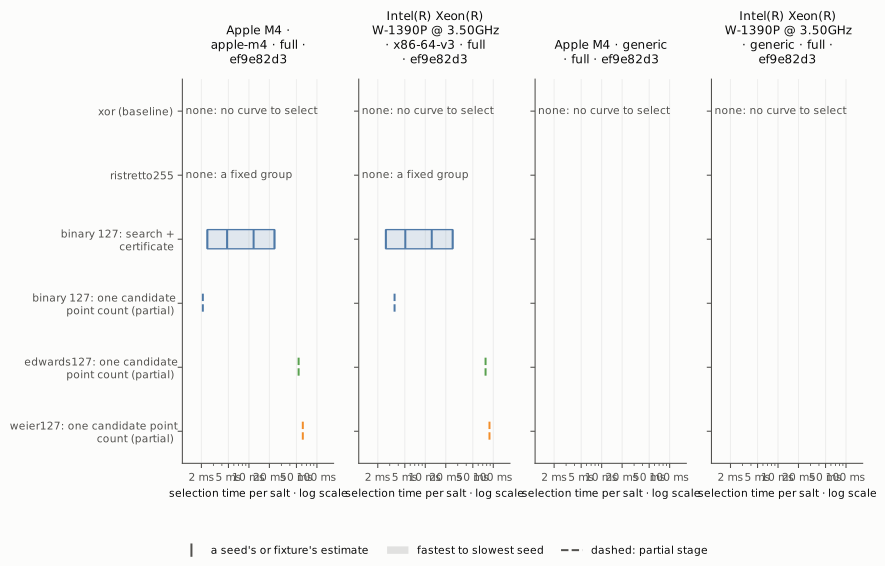
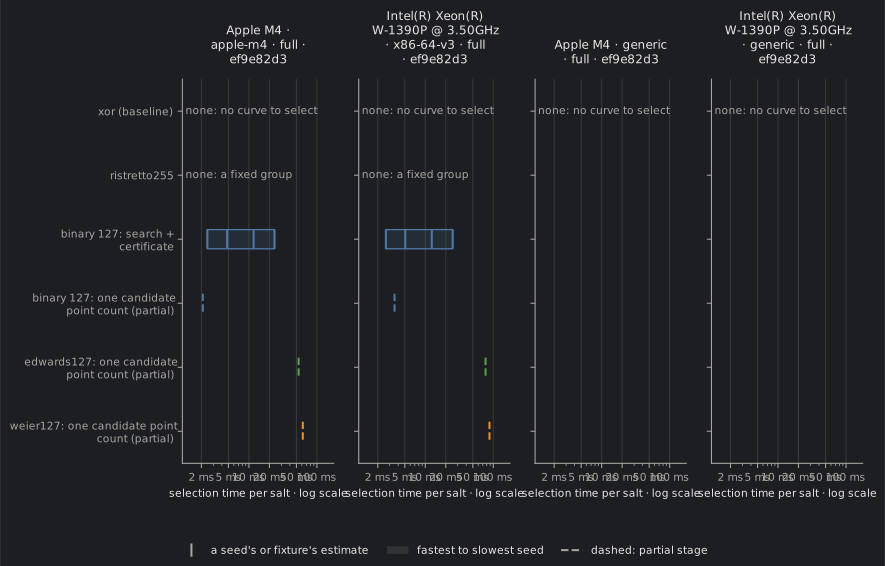
The time per salt of each selection stage, on a log scale: a tick at each seed’s estimate, or at the single candidate fixture of a point count, and a band from the fastest seed to the slowest; dashed marks are partial stages, lower bounds on . Unlike the ratio above, these times compare across families whatever their insertion cost. XOR has no curve and ristretto255 is a fixed group: neither selects a curve, as their rows state.
Cost per item with selection
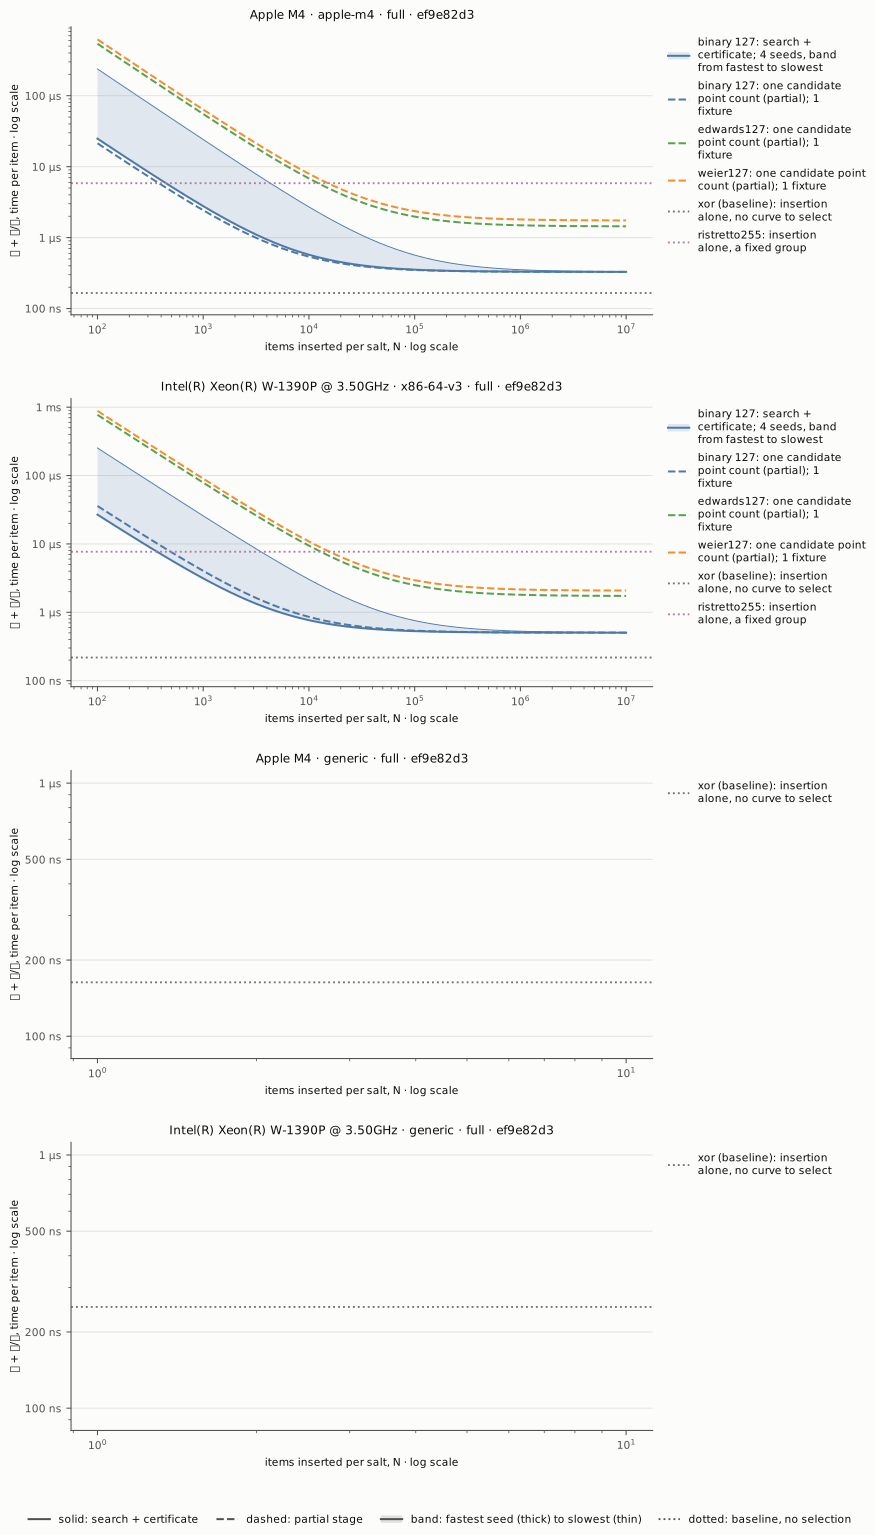
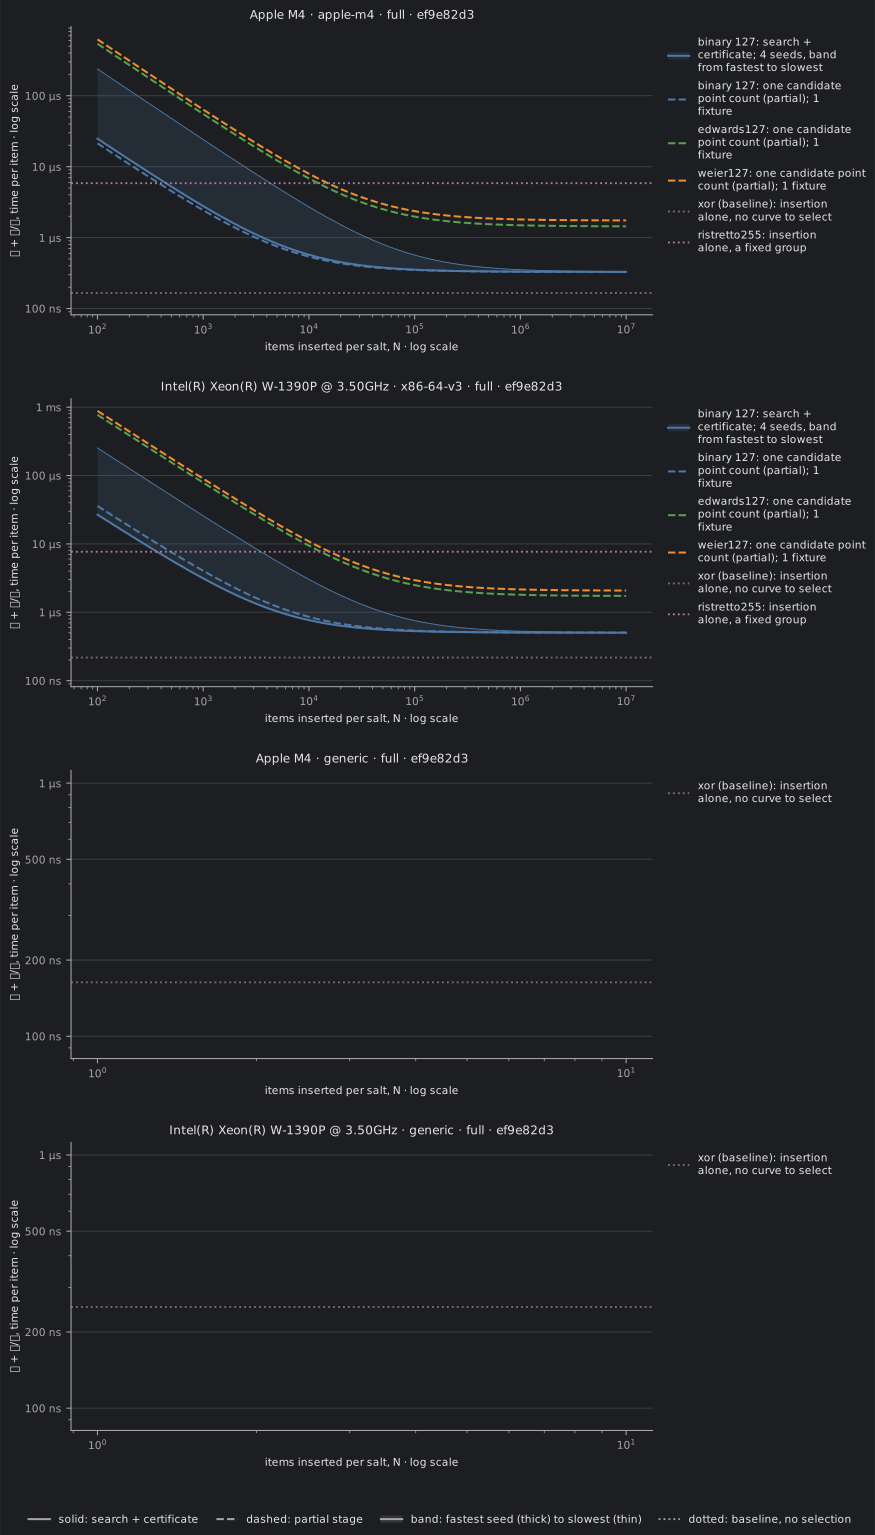
Insertion and amortised selection per item, , against the items inserted per salt, with the measured insertion per item ( items into a sketch of cells) and the selection time per salt above. As grows each curve falls to its family’s . The band spans the seeds, the fastest thick and the slowest thin; dashed curves are partial stages, lower bounds on . The dotted flat lines are the insertion of the baselines, XOR and ristretto255, which select no curve, so that is their whole cost per item.